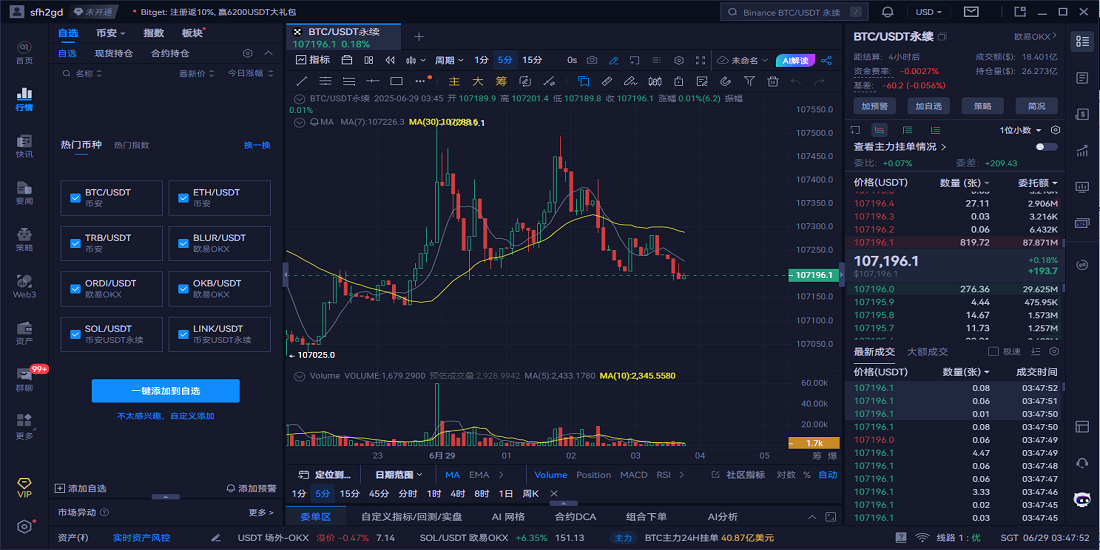
AiCoin Crypto Market Data and Analysis Tools
AiCoin brings crypto prices from multiple exchanges into one place. Compare spot and futures markets, chart price and volume, and set alerts for the pairs you follow. Market news and on-chain data provide context for what you see on the chart.
Crypto Prices, Candlestick Charts and Market Alerts



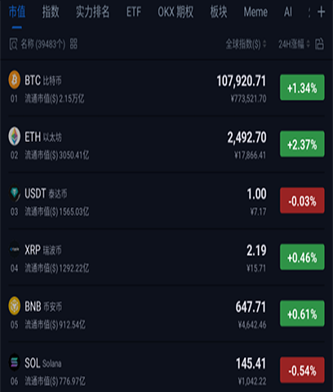
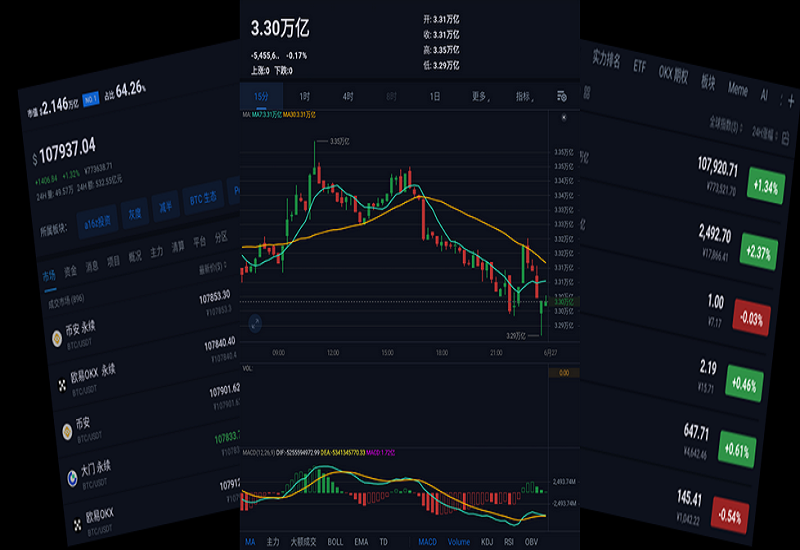
From market data
to chart analysis

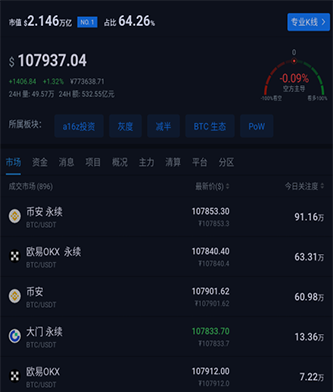
Compare Markets Across Exchanges
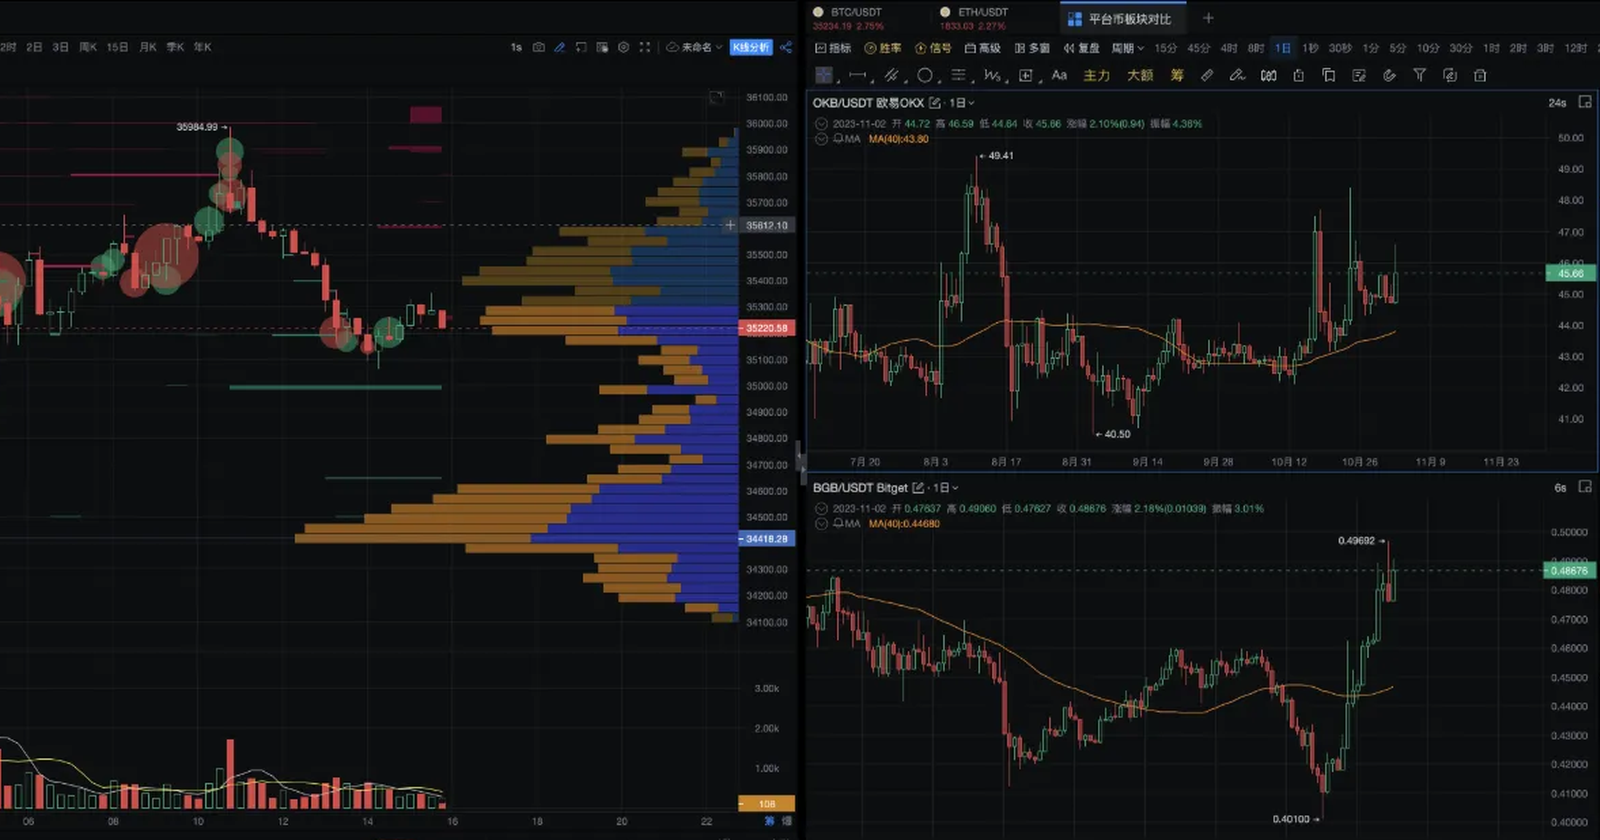
Open the same spot pair on two exchanges and compare its price, trading volume, and order-book depth over the same period.
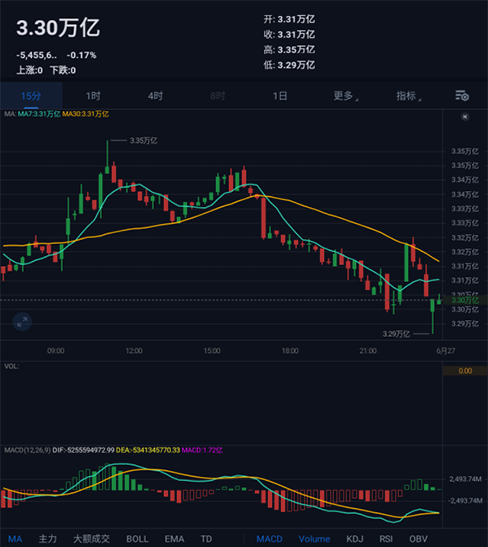
Candlestick Charts and Custom Indicators
Switch between timeframes, draw levels, and add technical indicators to a candlestick chart. Use AIScript to define and test your own indicator conditions.
Price Alerts and On-Chain Activity
Set a price or indicator alert for a pair on your watchlist. When it triggers, check the chart for recent trades and review any related on-chain transfers.
- Bitcoin
- Ethereum
- Tether
- Ripple
- Binance Coin
- Solana
- USD Coin
- TRON
- Dogecoin
- Cardano
- Wrapped Bitcoin
- Bitcoin Cash
- ChainLink
- Avalanche
- Shiba Inu
- Litecoin
- Monero
- Aave
- Pi Network
- Pepe
- Aptos
- Ethereum Classic
- Cronos
Crypto Market Data and Research Tools
-
Real-Time Crypto Prices
-
Candlestick Charts and Technical Indicators
-
Price, Volume and Signal Alerts
-
On-Chain Transfers and Address Activity
-
Multi-Exchange Watchlists
-
Crypto News and Market Context
- Bitcoin
- Ethereum
- Tether
- Ripple
- Binance Coin
- Solana
- USD Coin
- TRON
- Dogecoin
- Cardano
- Wrapped Bitcoin
- Bitcoin Cash Bitcoin Cash
- ChainLink
- Avalanche
- Shiba Inu
- Litecoin
- Monero
- Aave
- Pi Network
- Pepe
- Aptos
- Ethereum Classic
- Cronos




1. Review Price Moves and Large Trades.
2. Screen Assets by Market Cap, Price Change, and Volume.
3. Compare Spot and Futures Order Books.
4. Apply Custom Indicators Across Chart Timeframes.
5. Follow Large Transfers and Watched Addresses.
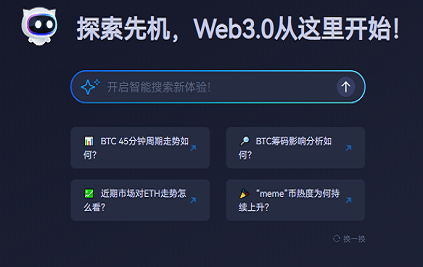
Review Price Moves and Large Trades
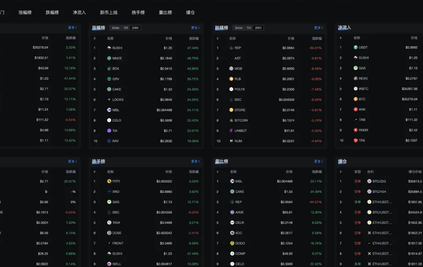
Screen Assets by Market Cap, Price Change, and Volume
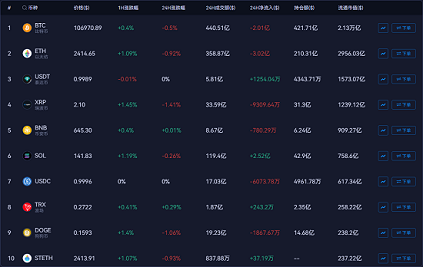
Compare Spot and Futures Order Books
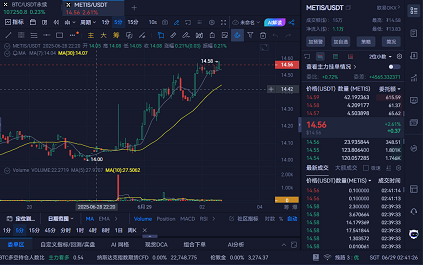
Apply Custom Indicators Across Chart Timeframes
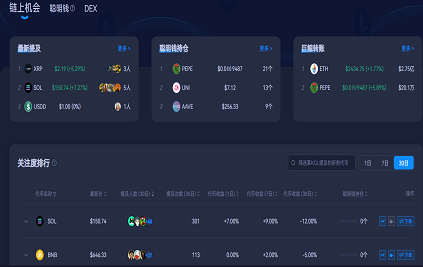
Follow Large Transfers and Watched Addresses
Tools for Crypto Market Research
-

Multi-Exchange Market Comparison
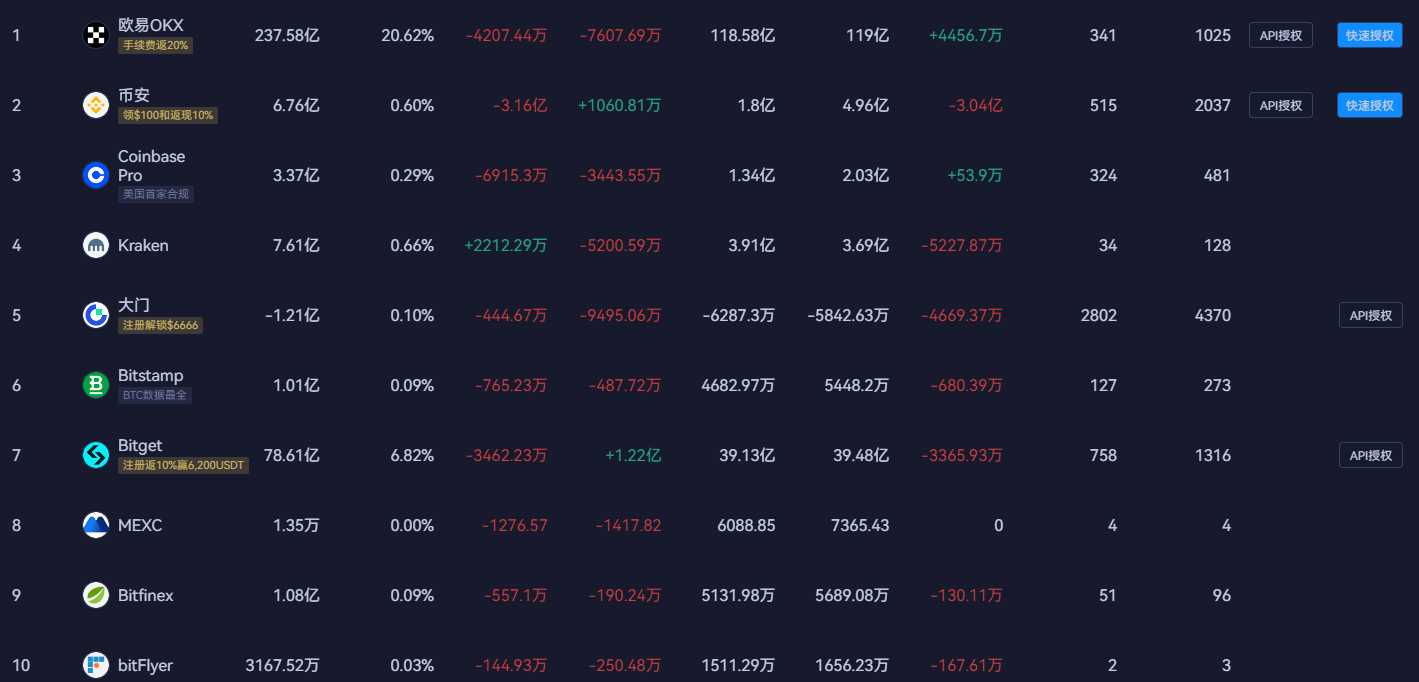
Spot and derivatives marketsCompare the same trading pair across supported exchanges. Match the quote currency and market type before comparing prices and volume.
-

Charting and Technical Indicators
Technical analysis and trend researchMark a price level on a Bitcoin or Ethereum chart, then switch timeframes to see how that level fits into the broader trend.
-

Multi-Window Market Monitoring
Desktop chart layoutsPlace a daily chart beside a shorter timeframe for the same pair, or use separate panels to monitor several pairs on one screen.
-

Derivatives and Funding Rate Analysis
Futures market dataCompare a perpetual futures price with its spot price and check the funding rate for that contract. Funding rates can differ across exchanges.
-

Price Movement and Signal Alerts
Market volatility monitoringSet a price, volume, or indicator threshold. The alert marks when the condition is met so you can review the trade activity around it.
-

Coin Prices and Market Rankings
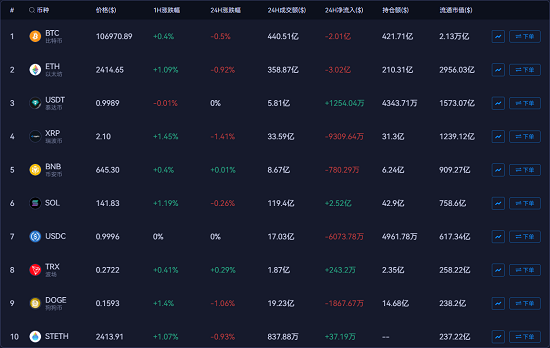
Coin discovery and basic analysisLook up an asset by name or ticker, then compare its price change, market cap, and trading volume before opening a specific trading pair.
-

Multi-Account and API Connections
Exchange account permissionsConnect supported exchange accounts to use available order tools. The exchange and the permissions granted to the connection determine which actions are available.
-

Desktop Charting and Market Review
Long-session market analysisKeep your watchlist and chart panels open side by side on the desktop client. Save a layout to return to the same view during a later session.
-

Mobile Watchlists and Alerts
Follow markets away from desktopCheck the pairs you follow on mobile and open the relevant chart when a price alert arrives.
-

Crypto News and Market Events
News context and event trackingCompare the timestamp of an exchange announcement or project update with changes in price and trading volume.
-

Drawing Tools and Custom Indicators
Personalized technical analysisMark trend lines and price levels, then add an indicator to track a specific condition on the chart.
-

Strategy Signals and Historical Testing
Indicator research and reviewReview when an indicator fired in historical data and compare the results across different market periods. Live results can differ from a backtest.
-

Historical Chart Review
Multi-timeframe market analysisUse a longer chart to put a short-term move in context, then zoom in to review the price and volume around the move.
-

Cross-Platform Market Access
Web and app continuityUse the web version for quick market checks, desktop clients for multi-window charting, and mobile apps for watchlists and alerts.
-

Price and Percentage Change Alerts
Watchlist monitoringChoose a target price or percentage move for a pair you follow and review the chart when the threshold is reached.
-

Crypto Rankings and Asset Screening
Trending market discoveryUse volume rankings to find the most actively traded assets and gainers or losers lists to find the largest price moves.
-

Custom Indicator Alerts
Charts, indicators, and alertsTurn a chart condition into a custom indicator, then set an alert for it where supported.
-

Order Books and Trade History
Open orders and executed tradesOrder books show bids and offers that are still open. Trade history records completed trades and lets you check the prices and sizes that actually traded.
-

Spot and Futures Spreads
Cross-market price comparisonCompare spot and futures prices for the same asset to see how the spread changes over time.
- For a meaningful comparison, check the quote currency, contract type, and timestamp of both prices.
-

News and Community Insights
Additional market contextRead industry news and community discussion alongside the chart to see whether the timing coincides with changes in trading activity.
- On-chain transfer records add another point of reference. A transfer records funds moving between addresses. It may occur without an exchange trade.
AiCoin Market Data and Charting FAQ
- AiCoin is a crypto market data and analysis platform. It brings exchange prices, candlestick charts, alerts, on-chain activity, and industry news into one place for market research.
- You can compare prices, trading volume, and order books across supported exchanges. Perpetual futures can also show funding rates. Coverage varies by exchange and pair.
- Yes. You can use built-in indicators or define custom conditions with AIScript. Desktop chart layouts let you compare those conditions across pairs or timeframes.
- Available triggers include price and volume changes, indicator conditions, large trades, and selected on-chain events. The available options depend on the client and the data source.
- The web version offers browser-based market research. Windows and macOS clients support multi-window charting, while the mobile apps let you check watchlists and receive alerts.
Download AiCoin for Desktop and Mobile
AiCoin Crypto Market Data on Web, Desktop, and Mobile